Data collection issues
| Attachment | Размер |
|---|---|
| ict-indicators.pdf | 6.03 MB |
Data is raw information such as the numbers programmed in your speed dial, the last ten numbers dialled on your mobile phone, the number of times you lent your phone to a friend last week, how many people use prepaid telephony and how many have postpaid subscriptions, how much it costs to make a call, whether you have email access via your phone, your home, your local telecentre or not at all, the hours that telecentres are open for business, whether your mother has ever made a long distance call, and so forth. Which of these are interesting and useful will depend on what is being measured. Which data will actually be used is contingent on a number of factors.
4.1 Access to data
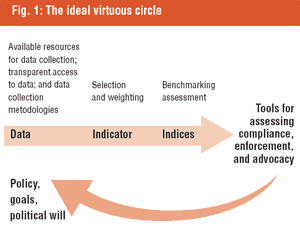
Data being out there does not necessarily mean that it is available or accessible. As shown in Figure 1, there has to be a determination of what kinds of illustration the data is intended to provide. If the policy being assessed targets women or youth, then it is clear that information from those groups will need to be pursued. As has often been the case, women, for example, have not been specifically targeted in policy, resulting in a lack of gender-disaggregated data. This means that a baseline for assessing initiatives that do now target women does not exist, making it difficult to assess progress or the success of such initiatives.
Data sources may have different reasons for withholding information. A recent survey on small and medium enterprise (SME) use of ICT (Esselaar et al, 2006) found that entrepreneurs provided inaccurate information due to concerns around taxation and competition, and also because of a lack of record-keeping.
4.2 Sample size and selection
To achieve a legitimate sample for an international level indicator you actually need a lot of data. Data collection can be an expensive proposition. By way of example, the 1990 US census cost USD 2.5 billion to undertake a 33-question census of a population of 248,718,301, which works out to USD 10.02 per person, or USD 75.5 million per question. In 2000, the 53-question census cost USD 4.5 billion at USD 15.99 per person or USD 84.9 million per question. [9] These costs do not include the time taken by individuals to self-administer the questions, and if you think in terms of a researcher administering surveys taking about 15 minutes each, it is not difficult to see the costs of achieving a representative sample, and even more so for a sample adhering to standards for international comparability.
4.3 Secondary use of data sets
While internationally comparable indicators may have their use, in many instances there may be more practical strategies for collecting information that is more complete than what already exists and is likely to be sufficiently accurate for project or policy development. An example of this is using ministry of education records, or even the local school boards, for obtaining information about ICT availability and use at the school or classroom level, rather than through the national statistical institutes.
Another important strategy is secondary use of data sets, using existing data sets for different purposes and combining data sets for reanalysis. There is a tendency to push for collection of data, with less attention being given to creative approaches to secondary analysis which can be equally revealing. For developing countries in particular this may be the fastest, best and cheapest way to shed initial light on a number of key issues. But there is also the risk of inheriting and hence perpetuating biases in the design of the collection model or other data errors.
4.4 Survey design
Data collection methodology is a large area and we will not go into detail here, but will only provide an illustration of this aspect’s complexity. For example, if you want to devise a survey to assess affordability of mobile telephony, as undertaken by LIRNEasia in their Telecom Use on a Shoestring project, [10] what kinds of evidence do you collect and what questions do you ask to ascertain this? In terms of affordability, are you concerned with the cost of services or the cost of acquiring a new handset and subsequent use? Some questions for the former include how often people use their phone to make calls (or conversely whether they only use it to receive calls); how expensive they perceive using their phone to be; and whether the cost of calls being reduced by X-percent would alter their usage of the phone. Further questions to round out the picture include inquiry into different modes of communication (fixed, mobile or public access), what the respondents felt were the benefits of access, and the respondent’s monthly communication expenditure.
Once the questions are determined, however, it is still a methodological challenge to get accurate results. Just the last question of monthly communication expenditure can be difficult to accurately remember, especially if prepaid cards are used.
4.5 Summing up…
Reliable indicators aim for transparency around data sampling and collection procedures. This transparency is achieved through clarity of definitional terms and their explication, a clear statement of methodology and methodological issues including how conflicting data are resolved, how often new data is collected, the size of the sample, and the strategy for achieving a random and representative sample. Because political motivations for collecting particular kinds of data are of paramount importance, it is useful to have clarity around who is responsible for data collection and under what conditions (e.g. of remuneration).